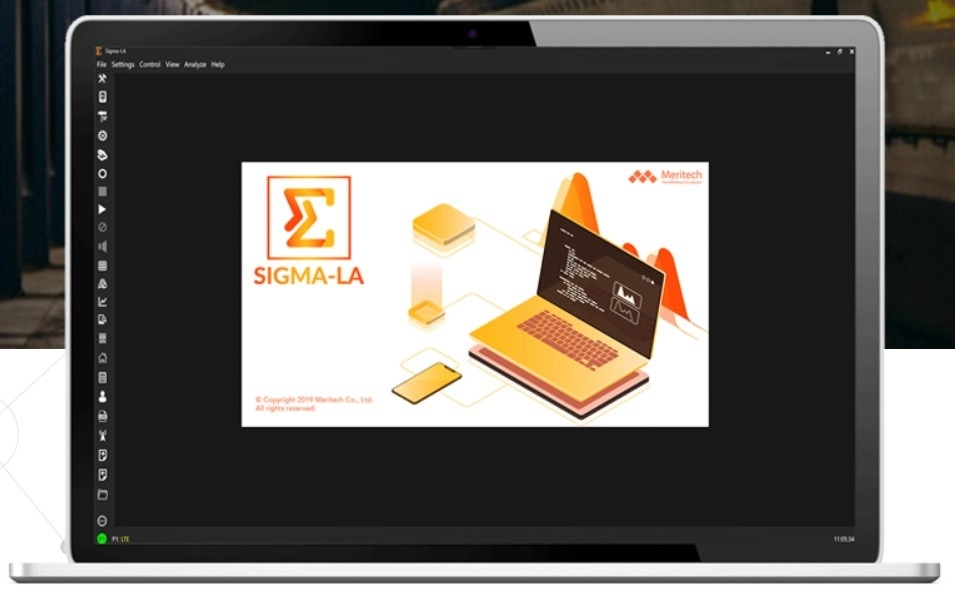
Sigma-LA Mobile Network Measurement Tool
Monitoring & Optimization
Sigma-LA is a very effective tool to verify radio network quality through drive tests. It helps in competitive measurement among the networks. It supports data collection for NR5G / LTE / WCDMA / GSM / GPRS networks. It has out-of-the-box support for hundreds of KPIs like including throughput parameters, packet error rate etc. It supports data collection with built in KPIs for Layer 1, Layer 2 and Layer 3 of the networks.Intuitive Displays
Sigma-LA has been designed with drive test operator at site in mind with intuitive screens and displays. Various views for quick analysis like Protocol Message View, L1 data on graphs, live maps etc. all in sync with each other have been built in which helps in making a better judgment of network status. L3 messages can also be decoded in real time and can be displayed with decoded tree structure. The displays are highly customizable so that users can adjust them as per their requirements. Live data display makes analysis on the go much easier.Troubleshooting
Sigma-LA supports playback of log files collected through it in the field. With intuitive features like displaying Call Events on the Cell Search Charts it makes analysis a very easy task. One can synchronize the L3 Decode view with the Map Display and align them side by side, so as to easily understand the detailed status of network problems. Analysis like Handovers and Radio Link Failures etc. are presented live on the views.Sigma-LA supports playback of log files collected through it in the field. With intuitive features like displaying Call Events on the Cell Search Charts it makes analysis a very easy task. One can synchronize the L3 Decode view with the Map Display and align them side by side, so as to easily understand the detailed status of network problems. Analysis like Handovers and Radio Link Failures etc. are presented live on the views.


